
Figure EV3. Bimodal peptides in TRIP13E253Q HDX‐MS.
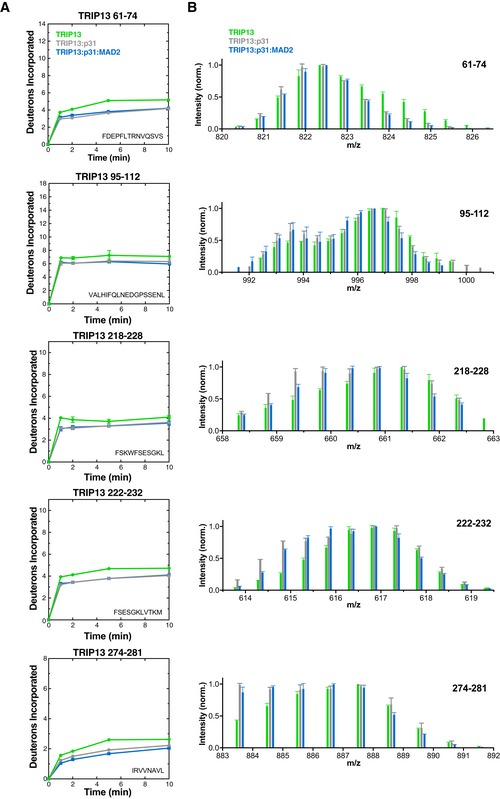
- Deuterium uptake plots for TRIP13 peptides showing bimodality in HDX‐MS analysis of one or more states (TRIP13E253Q alone green, TRIP13E253Q:p31comet gray, TRIP13E253Q:p31comet:MAD2 blue). Error bars represent standard deviation from triplicate measurements.
- Sticks (MS peak height versus mass/charge ratio, average and standard deviation of three independent samples) for TRIP13 peptides shown in panel (A). Each set of data shows peaks at the same m/z ratios; datasets are shifted on the graph for clarity.