-
A
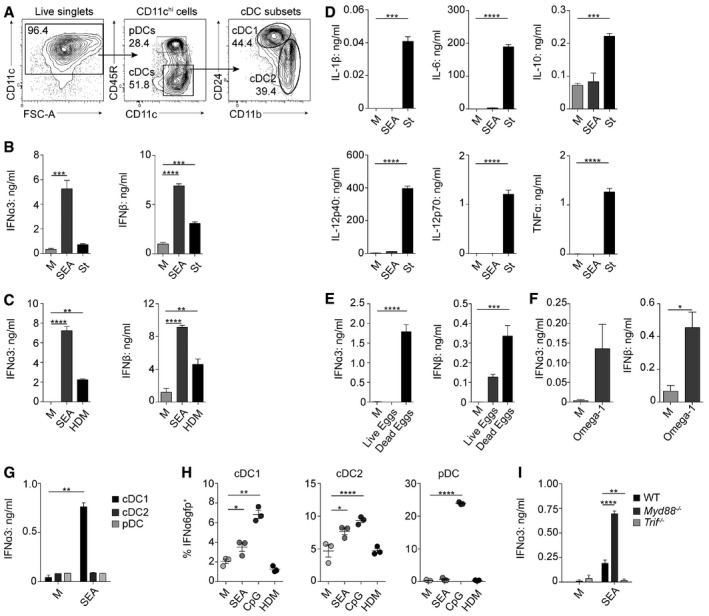
FLDC subsets were defined by expression of CD11c, CD45R (B220), CD11b, and CD24. pDCs were identified as CD45R+ CD11clo; cDCs are CD11c+ CD45R− with cDC1 and cDC2 subsets.
-
B, C
IFN‐I production as measured by ELISA on supernatants from bulk cultures cultured in medium alone (M) or stimulated with 25 μg/ml soluble egg Ag from Schistosoma mansoni (SEA) (B, C), 5 μg/ml Salmonella typhimurium (St) (B), or 50 μg/ml house dust mite (HDM) extract (C).
-
D
Production of DC cytokines from bulk cultures following exposure to SEA or St.
-
E–G
IFN‐I production as measured by ELISA on supernatants from bulk cultures cultured in medium alone (M) or stimulated with 1:500 live or dead whole S. mansoni eggs (E), 0.5 μg/ml recombinant omega‐1 (F), or FACS‐isolated subsets after stimulation with SEA (G).
-
H
Percentage of IFNα6GFP+ DCs after stimulation with SEA, 1 μg/ml CpG, or HDM.
-
I
IFNα3 production by WT, Myd88
−/−, and Trif
−/− bulk FLDCs after exposure to SEA.
Data information: Results are mean ± SEM. *
< 0.0001 (one‐way ANOVA). Data from one of three or more experiments (
= 3 replicate wells per group).

