
Figure 2. FLDCs migrate to the dLN and induce Ag‐specific responses following adoptive transfer.
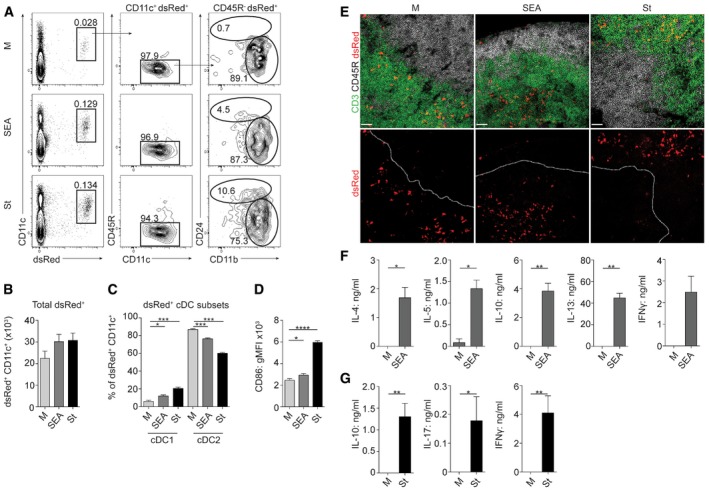
Following Ag stimulation, dsRed+ FLDCs were injected s.c. into naïve WT mice, and 48 h later, dLNs were harvested and the presence of dsRed+ CD11c+ cells was assessed by flow cytometry (A, B) or confocal microscopy (E).
-
AdsRed+ CD11c+ FLDCs were gated as pDCs (CD45R+), cDC1s (CD45R− CD24+), or cDC2s (CD45R− CD11b+).
-
BAbsolute numbers of dsRed+ CD11c+ FLDCs in the dLN calculated from flow analysis and cell counts.
-
CPercentage of transferred dsRed+ CD11c+ cells that were cDC1s or cDC2s.
-
DCD86 expression on transferred dsRed+ CD11c+ FLDCs.
-
EConfocal microscopy of dLN sections after FLDC transfer: Upper row depicts overlay of CD3 (green), CD45R (gray) and dsRed (red); bottom row depicts dsRed (red) alone. White dashed line represents division between T cell (CD3+) and B cell zones (CD45R+). Scale bars represent 38 μm.
-
F, GSeven days after transfer, dLN cells were restimulated for 72 h with 15 μg/ml SEA (F), 1 μg/ml St (G), or medium alone (M) and cytokine production assessed by ELISA.