
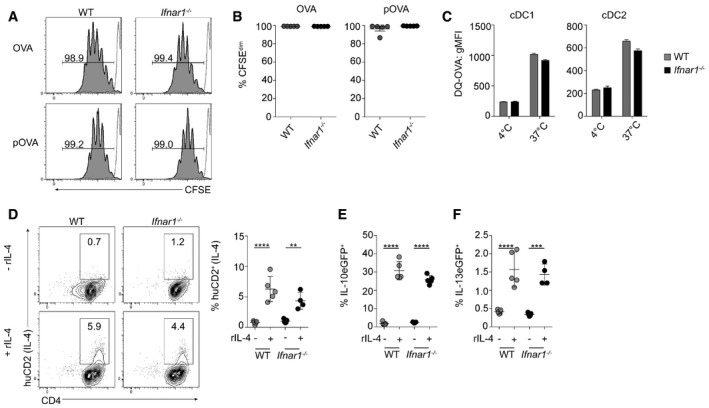
Figure 4. Ifnar1 −/− FL‐cDC APC function is comparable to WT FL‐cDC in vitro .
-
A, BFL‐cDCs were sorted and co‐cultured with CFSE‐labeled OT‐II T cells, with either OVA protein (OVA) or peptide (pOVA), for 96 h. Proliferation was determined by flow cytometric analysis of CFSE dilution. The gray dashed line represents non‐proliferating OT‐II T cell controls.
-
CTo assess Ag uptake and processing, WT or Ifnar1 −/− FLDCs were cultured with DQ‐OVA for 2 h at 37°C or 4°C and uptake assessed by flow cytometry.
-
D–FSorted FL‐cDCs were cultured with eGFP− CD4+ T cells from KN2xIL‐13eGFP or KN2xIL‐10eGFP animals, with anti‐CD3, in the presence (+) or absence (−) of 20 ng/ml rIL‐4. IL‐4 (huCD2, D), IL‐10eGFP (E), or IL‐13eGFP (F) expression on CD4+ T cells was assessed by flow cytometry after 72 h of culture. Positive cells were expressed as a percentage of all CD4+ T cells.