
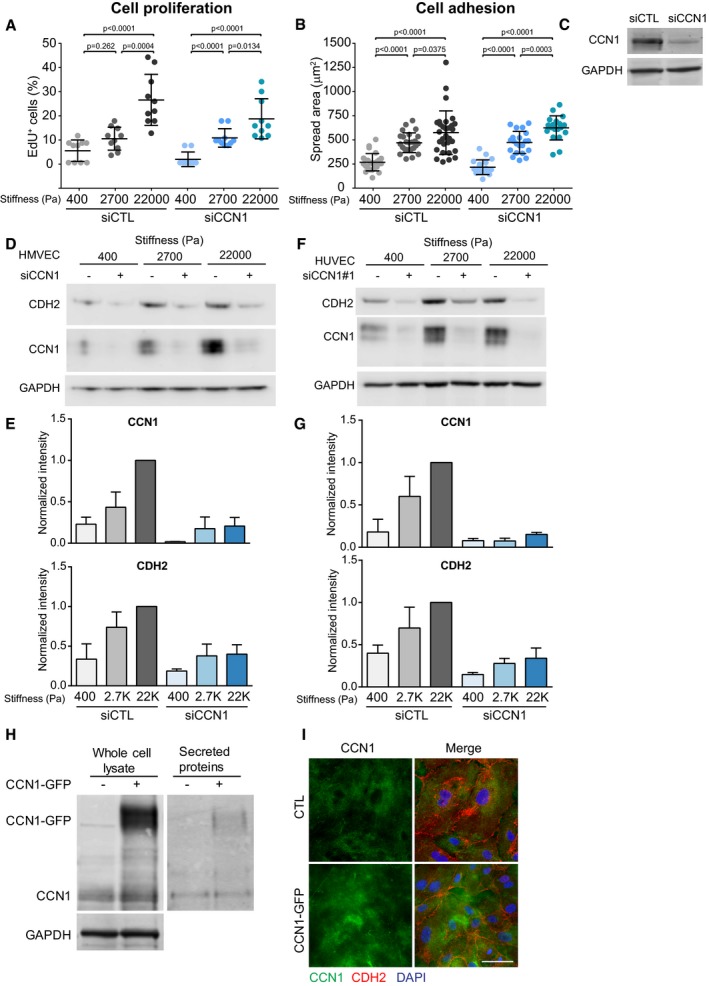
Figure EV2. CCN1 controls N‐cadherin levels in endothelial cells.
-
A, BSpread area (B) and proliferation (A) of HUVECs cultured on FN‐coated PAGs of indicated stiffnesses were not altered following CCN1 knockdown. Significance according to two‐tailed unpaired t‐test. Data are represented as mean ± SEM. For panel (B), n = fields assessed from one representative experiment of three biological replicates; siCTL: n = 25 (400, 2,700 Pa), n = 30 (22,000 Pa); siCCN1: n = 19 (400, 22,000 Pa), n = 21 (2,700 Pa). For panel (A) n = 10 fields per stiffness from 3 replicate experiments.
-
CRepresentative Western blot for CCN1 shows knockdown efficiency in HUVECs used in panels (A and B).
-
D, ERepresentative Western blot analysis (D) and quantification (E) showing that in HMVECs, stiffness induces CCN1 and N‐cadherin (CDH2) levels and that silencing of CCN1 with a pool of siRNAs reduces N‐cadherin levels. CCN1 and N‐cadherin quantification based on Image Studio Lite software. Bars represent mean ± SEM (n = 3 replicate experiments).
-
F, GRepresentative Western blot analysis (F) and quantification (G) showing that in HUVECs, stiffness induces CCN1 and N‐cadherin levels and that silencing of CCN1 with a single siRNA reduces N‐cadherin protein levels. CCN1 and N‐cadherin levels were normalized by GAPDH, which was used as a loading control. CCN1 and N‐cadherin quantification based on Image Studio Lite software. Bars represent mean ± SEM (n = 3 replicate experiments). Same Western blot shown in Fig 4A.
-
HRepresentative Western blot analysis of HUVECs transiently transfected with CCN1‐GFP vector and cultured for 24 h showing that GFP‐tagged CCN1 is abundantly expressed in whole‐cell lysates and secreted in the media at the expected molecular weight (42 kDa for CCN1 + 28 kDa for GFP = 70 kDa).
-
IImmunofluorescence staining showing that the localization of CCN1‐GFP mirrors that of endogenous CCN1 diffusely in the matrix. Cells from a control transfection were stained for CCN1 (green), N‐cadherin (red), and DAPI, while CCN1‐GFP‐overexpressing HUVECs were stained with N‐cadherin (red) and DAPI only. Scale bar = 50 μm.
Source data are available online for this figure.