
Figure EV3. Efficient KO of Ccn1 in Ccn1 KOEC mice.
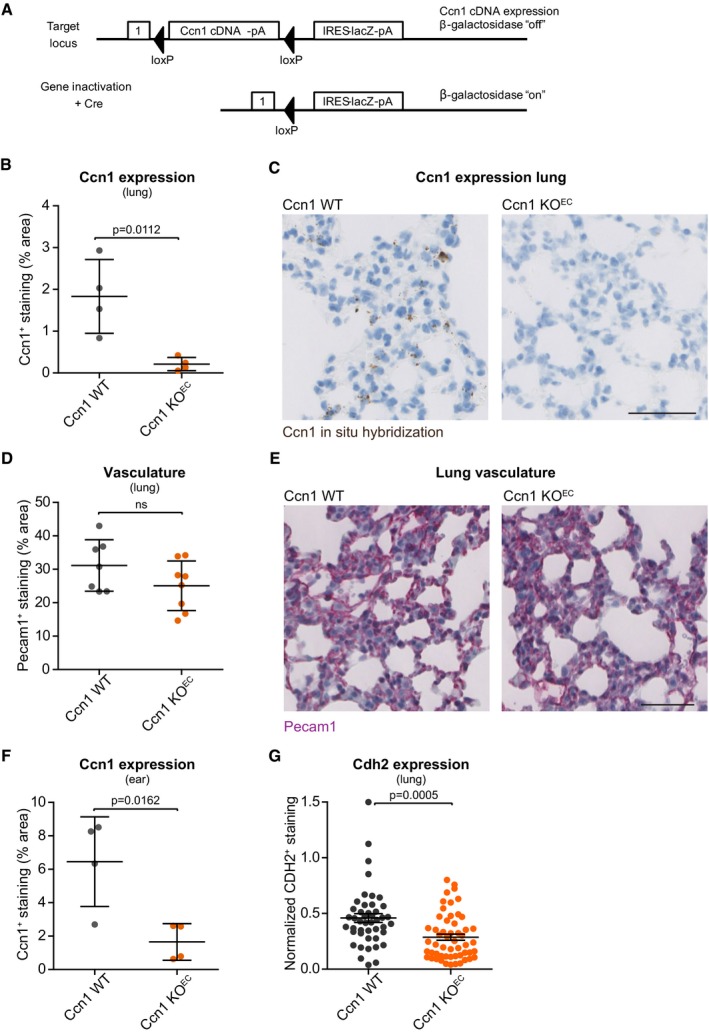
- The gene locus of Ccn1 fl/fl mice showing the LacZ reporter gene activation once recombination has occurred.
- Quantification of Ccn1 expression (in situ hybridization with RNAscope), showing that Ccn1 is expressed in the lung of Ccn1 WT mice, and the efficient depletion of Ccn1 expression in the lung of Ccn1 endothelial‐specific conditional KO mice (Ccn1 KO EC). N = 4 mice assessed per group.
- Representative staining of lung sections quantified in (B). Scale bar = 100 ?m.
- Quantification of the immunostaining for Pecam1 in the lung of Ccn1 WT and Ccn1 KO EC mice showing the absence of significant differences in the total lung vasculature upon depletion of Ccn1 in the endothelium. N = 7 (Ccn1 WT) and 8 (Ccn1 KO EC) mice assessed.
- Representative staining of lung sections quantified in (D). Scale bar = 100 ?m.
- Quantification of Ccn1 expression (in situ hybridization with RNAscope) showing that Ccn1 is expressed in the ear of Ccn1 WT mice and the efficient depletion of Ccn1 expression in the ear of Ccn1 KO EC mice. N = 4 mice assessed per group.
- Quantification of N‐cadherin (Cdh2) expression (in situ hybridization with RNAscope; total staining normalized by cell content) showing that depletion of Ccn1 in the endothelium decreases the levels of N‐cadherin in the lungs (n = 45 (Ccn1 WT) and 54 (Ccn1 KO EC) fields assessed from 5 female mice for Ccn1 WT and 6 female mice for Ccn1 KO EC).