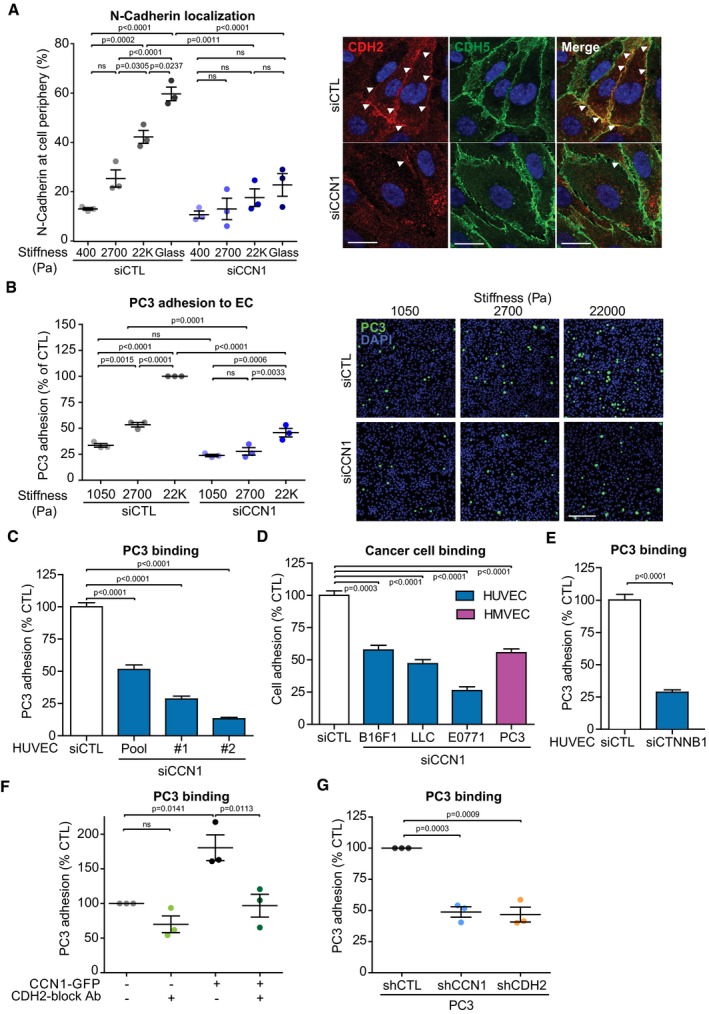
Representative immunofluorescence analysis and quantification for N‐cadherin (CDH2) in HUVECs cultured for 24 h on FN‐coated PAGs or FN‐coated glass showing that the localization at the cell periphery increases with elevated stiffness, which was reduced with CCN1 knockdown. White arrowheads highlight localization of CDH2 at the cell periphery. VE‐cadherin (CDH5) staining is not altered in CCN1‐silenced cells. Scale bar = 20 μm.
Representative immunofluorescence and quantification analysis showing that more PC3 cells adhere to HUVECs cultured on FN‐coated PAGs of high matrix stiffness; however, CCN1 knockdown in the HUVECs largely prevents this increased adhesion. Scale bar = 200 μm.
Silencing of CCN1 with a pool of siRNA (pool) or two single siRNAs (#1 and #2) in HUVECs reduces the binding of PC3 cells. siCTL n = 168, siPool n = 18, si#1 n = 83, si#2 n = 89 fields measured from three independent experiments, each performed in three technical replicates. The significance for each siCCN1 was calculated against each specific control.
Silencing of CCN1 with a pool of siRNA in HUVECs or HMVECs reduces the binding of B16F1 melanoma, Lewis lung carcinoma (LLC), E0771 breast cancer, and PC3 cells. CTL n = 248, LLC/E0771 n = 90, PC3 n = 70 fields measured from three independent experiments, each performed in three technical replicates. B16F1 n = 3 averaged measurements from three independent experiments. The significance for each cell line was calculated against their specific control.
Silencing of β‐catenin (CTNNB1) with a pool of siRNA in HUVECs reduces the binding of PC3 cells. N = 90 fields assessed from three independent experiments, each performed in three technical replicates.
Overexpression of CCN1‐GFP in HUVECs increases PC3 adhesion, which is ablated in the presence of an antibody that functionally blocks the homophilic interaction of N‐cadherin (CDH2).
Stable shRNA expression in PC3 cells targeting either CCN1 or CDH2 decreases their binding to control HUVECs.
Data information: Data are represented as mean ± SEM. For panels (A, B, and F), significance according to one‐way ANOVA with Tukey's test for multiple comparisons (
= 3 replicate experiments). For panels (C–E and G), significance according to two‐tailed unpaired
‐test. ns: non‐significant.