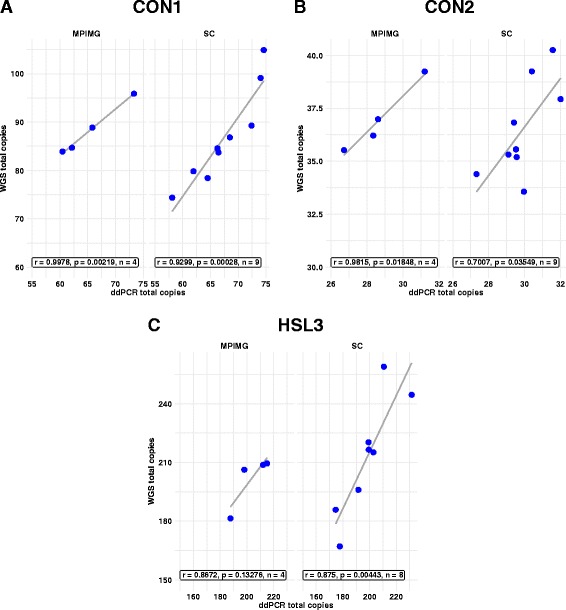
Fig. 6.

Correlation between whole genome sequencing and ddPCR copy number measurements for three representative DUF1220 clades; a CON1, b CON2, and c HLS3. Data shown is the ‘Best Align’ prediction of copy number for select samples from the CLM population (each point represents a single person) of the 1000 Genomes dataset, split by sequencing center, plotted against the measured copy number by ddPCR, using primers specific for each of the three DUF1220 clades. MPIMG = Max Plank Institute for Molecular Genetics, SC = Wellcome Trust Sanger Institute (SC). The Pearson correlation coefficient r is shown
