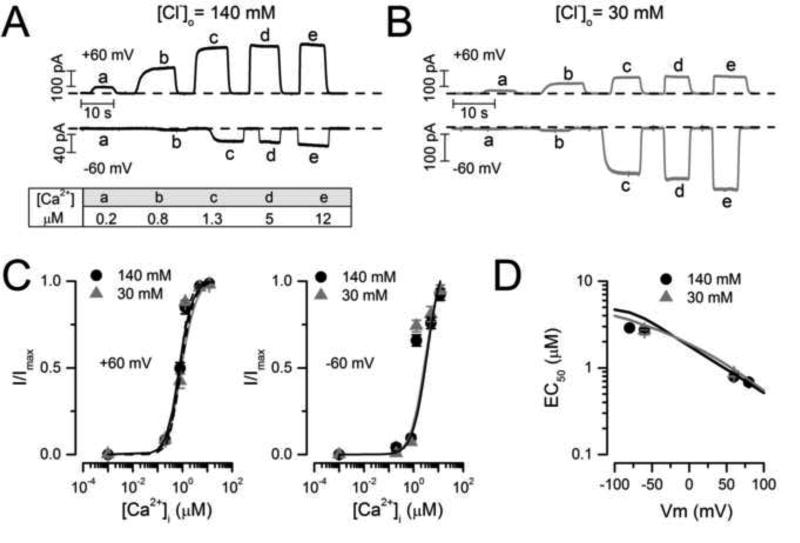
Fig 8. The apparent Ca2+ sensitivity of TMEM16A was not altered by lowering the [Cl−]o.
A–B Typical ICl recordings from inside-out patches held at ± 60 mV and exposed to 140 mM (A) or 30 mM [Cl−]o (B). ICl were activated by applying 0, 0.2 (a), 0.8 (b), 1.3 (c), 5 (d) and 12 µM [Ca2+]i (e). Dashed lines indicate ICl obtained with 0 [Ca2+]i and 25.2 mM EGTA. (C–D) Dose-response and EC50 vs Vm curves (symbols) obtained from experimental data like that shown in A and B were identical to the predictions made with Scheme IV at 30 (grey lines) and 140 (black lines) mM [Cl−]o.

