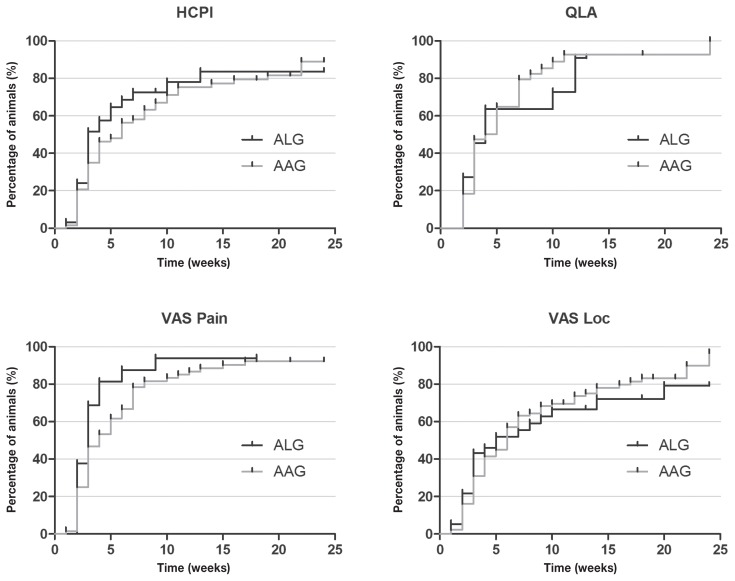
Figure 10.
Kaplan-Meier curve for Helsinki chronic pain index (HCPI), quality of life assessment (QLA), visual analog scale for pain (VASpain) and locomotion (VASloc) for dogs with neurological diseases (n = 145), during 24 wk of treatment with acupuncture and related techniques (ALG, n = 42) or acupuncture and analgesic therapy (AAG, n = 103). Each rung represents the percentage of animals which obtained scores of ≤ 22 at HCPI, ≥ 24 at QLA and ≤ 33 in both VAS over time. The small vertical lines in each graph represent the week in which treatment was successful in at least one patient. The vertical axis represents the percentage success achieved at each week of treatment until 24 wk.

