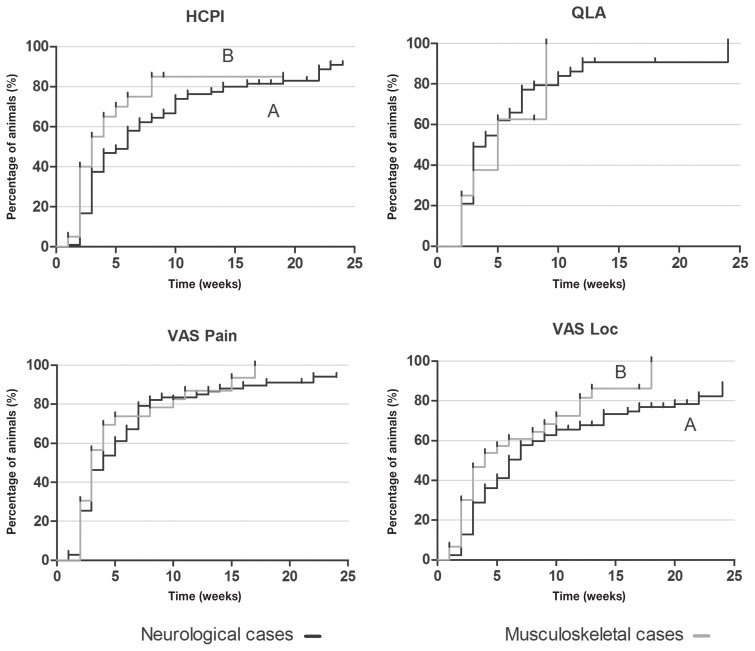
Figure 8.
Kaplan-Meier curve for Helsinki chronic pain index (HCPI), quality of life assessment (QLA), visual analog scale for pain (VASpain) and locomotion (VASloc) for dogs with neurological (n = 145) and musculoskeletal (n = 36) diseases grouped, during 24 wk of treatment with (ALG, n = 50) or acupuncture and analgesic therapy (AAG, n = 131). Each rung represents the percentage of animals which obtained scores of ≤ 22 at HCPI, ≥ 24 at QLA and ≤ 33 in both VAS over time. Different capital letters express differences between groups during 24 wk, with A > B. The small vertical lines in each graph represent the week in which treatment was successful in at least 1 patient. The vertical axis represents the percentages success achieved at each week of treatment until 24 wk.

