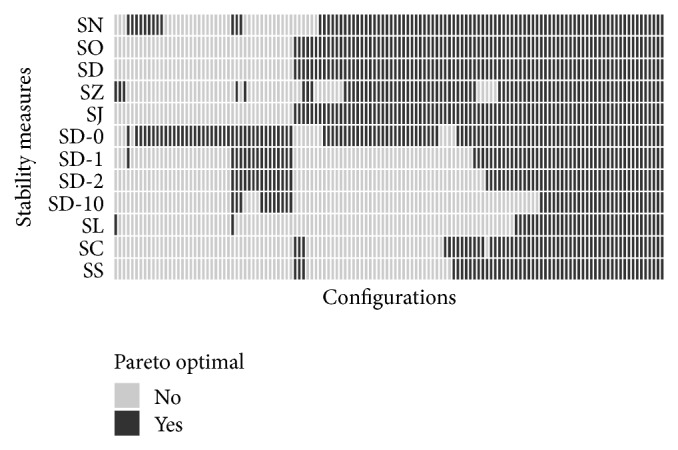
Figure 7.

Pareto optimal configurations per stability measure. The colors indicate whether a configuration is Pareto optimal considering classification performance, mean size of chosen features, and stability assessed by one of the 12 different stability measures. Only the 132 configurations which are Pareto optimal for at least one stability measure are displayed here.
