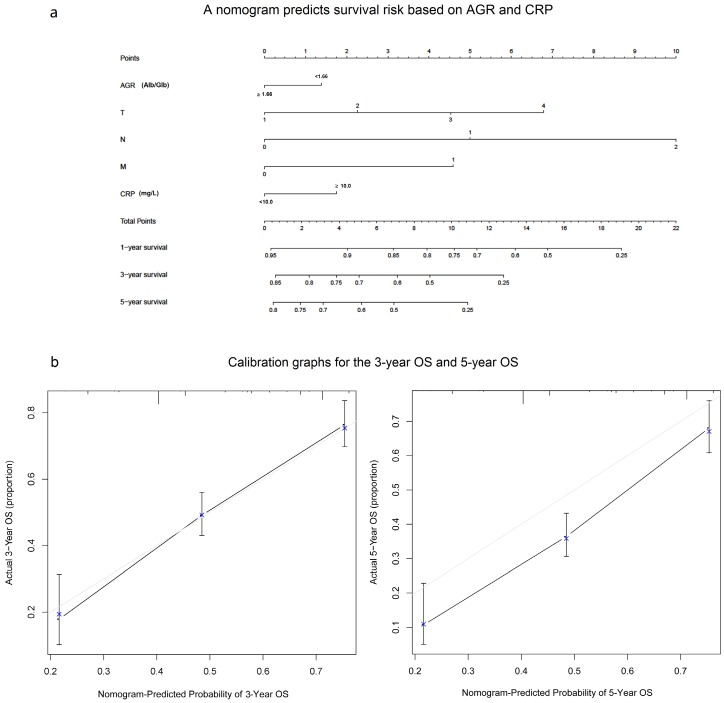
Figure 6.
A nomogram predicts survival risk based on AGR and CRP(a) and Calibration graphs for the 3-year OS and 5-year OS(b). The nomogram is used by totaling the points identified at the top of the scale for each independent factor. This total point score is then identified on the total points scale to determine the probability of risk prediction. The Harrell's c-index for OS prediction was 0.687(a). The calibration curve for probability of 3-year OS and 5-year OS showed good agreement between prediction by nomogram and actual observation(b).

