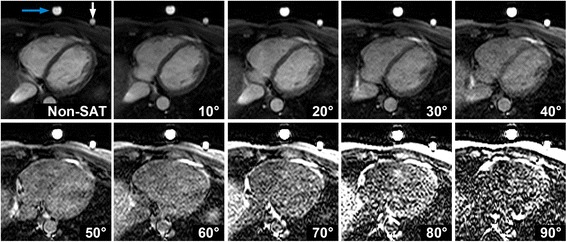
Fig. 1.

Images acquired with the pSAT sequence in one healthy volunteer using different pSAT angles (Blue arrow = syringe, white arrow = balloon wedge catheter). Image contrast was adjusted for each image to a window with minimum of 0 and maximum equal to twice the average right ventricular blood signal. Intermediate pSAT angles of 20°-40° enabled simultaneous visualization of balloon, blood and myocardium
