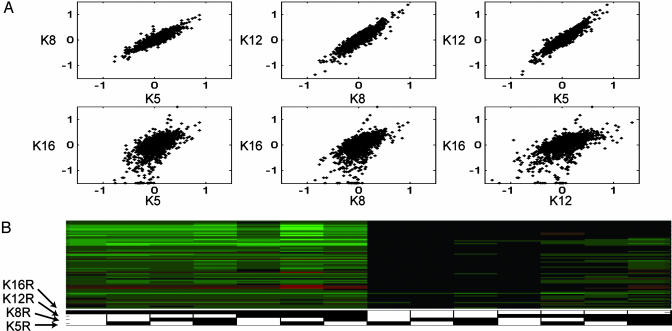
Fig. 2.
K16R-specific gene expression. (A) Incremental gene expression values were plotted against each other for the residues noted. (B) K16R discriminators. ORFs having expression regulated by a specific residue mutation, independent of the mutation states of the other three residues, are shown for K16R, selected with α = 0.01 after Bonferroni correction (see Materials and Methods and Fig. 4).

