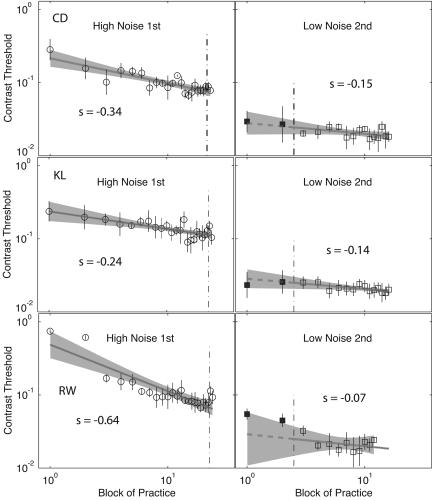
Fig. 3.
Threshold training improvements and transfer for three observers trained first in high noise (high→low). The log10 contrast threshold is shown, averaged over two adaptive staircases (75% accuracy), versus log10 practice block for the initial training in high noise (Left) and the pretest baseline (two points) and the posttransfer training in low noise (Right). Error bars indicate 95% confidence intervals for each threshold, and the 95% confidence region around the regression lines are shaded in gray. Filled circles to the left of the vertical line were collected in pretesting or in phase 1, and points to the right of the vertical line were collected in phase 2 or posttesting.

