Fig. 2.
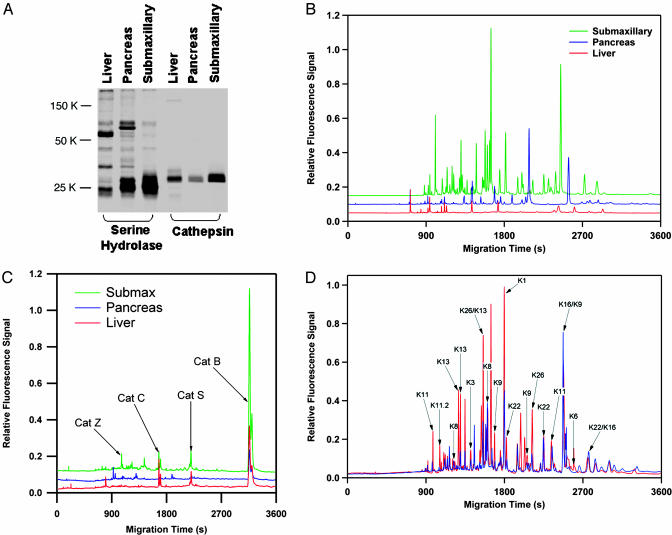
Proteomic profiling of serine and cysteine proteases with the Xsite method. (A) SDS/PAGE analysis of mouse liver, pancreas, and submaxillary proteomes after labeling with the serine hydrolase probe FP-PEG-TAMRA and the cathepsin probe AX6429. Analysis of the same three proteomes by using the CE-LIF method after digestion of the proteomes with trypsin shows greatly increased resolution for both serine hydrolases (B), and cathepsins (C). Despite the similarity between serine hydrolase profile of the pancreas and submaxillary by using SDS/PAGE, the CE-LIF method suggests these proteomes are highly distinct. Additionally, the CE-LIF separation suggests the presence of many more proteins than the number of bands on the SDS/PAGE gels. This result is because of the presence of multiple labeled species in these proteomes with common molecular weights. (D) The submaxillary proteome was analyzed by LC-MS/MS, and the identities of the CE peaks were determined (red trace, annotations). Several members of the kallikrein group of serine proteases were found. Addition of the protease inhibitor nafamostat (blue trace) indicated that this compound selectively inhibited a subset of these enzymes.

