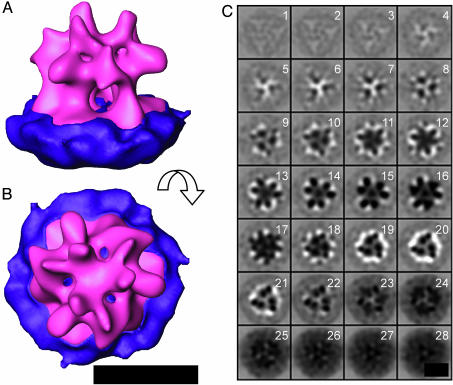
Fig. 5.
Final Env structure. (A and B) Isosurface representation of the resulting average at 4-μm defocus of Env as seen from the side (A) and the top (B). Manual segmentation of the viral membrane (purple) and the complex (magenta) was performed to visualize the complex. (C) Env visualized as in Fig. 4. (The scale bar corresponds to 10 nm.)

