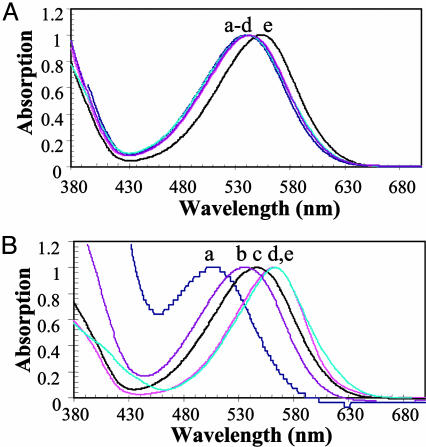
Fig. 2.
Absorption spectra of the MC state of the thiol-reactive probes. (A) Absorption spectra of the MC state of the five thiol-reactive probes described in this work in ethanol at a concentration of 20 μM. The maximum absorption value of the lowest energy transition for each probe is normalized to a value of 1.0. The letters a-e refer to compounds 3, 9, 12, 13, and 6, respectively. (B) Absorption spectra of the MC state of compound 12 in the following solvents: curve a, water; curve b, 1,2-propanediol; curve c, 2-propanol; curve d, acetonitrile; and curve e, dichloromethane.

