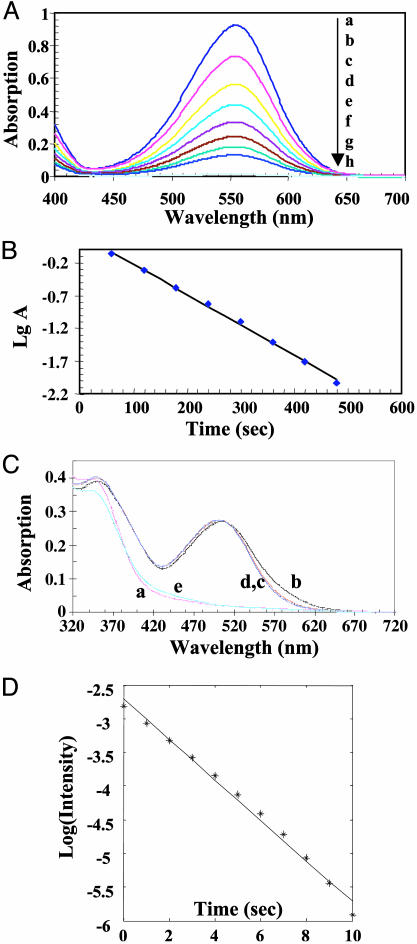
Fig. 5.
Thermally driven transitions between MC and SP states. (A) Time-dependent absorption spectra of the lowest energy transition of MC for compound 12 dissolved in ethanol at a concentration of 20 μM at 20°C in the dark. The spectra, from top to bottom, were recorded at the following times: a, 0; b, 60 s, c, 120 s; d, 180 s; e, 240 s; f, 360 s; g, 420 s; and h, 480 s. The lowermost curve is the spectrum of the nonirradiated SP state. (B) The rate for the thermally driven MC-to-SP transition was determined by analyzing the log of the maximum absorption value for each spectrum shown in A as a function of time. The reaction rate of 270 s-1 was calculated by using a least-squares fitting procedure. (C) Absorption spectra of the MC-G-actin conjugate (compound 9) as a function of time in the dark. Spectra are as follows: a, before irradiation; b, after 30-s irradiation with 365-nm light; c, after 5 min in the dark at 20°C; d, after 22 min in the dark at 20°C; and e, after irradiation with 546-nm light for 30 s. (D) Plot of the logarithm change in MC absorption vs. time for the thermally driven MC-to-SP transition of spironaphthoxazine-labeled G-actin in G-buffer/50% propylene glycol at 20°C.

