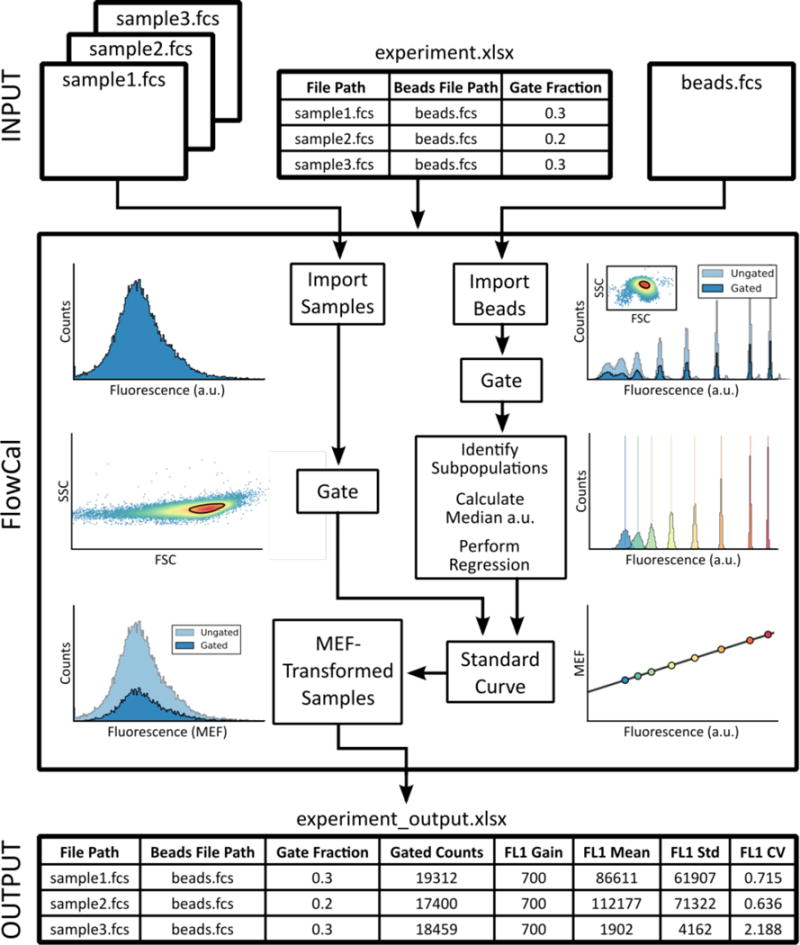
Figure 1.

Schematic of the FlowCal package, illustrating the Excel UI workflow. The Excel UI interacts with the underlying Python API and the individual modules involved in calibration particle and cell sample processing. The FlowCal outputs are plots of each step involved in generation of the a.u. to MEF standard curve (density gating, microbead population clustering, and standard curve fitting), scatter plots and histograms for each cell sample in MEF units, and an Excel file containing statistics for each cell sample.
