Figure 2.

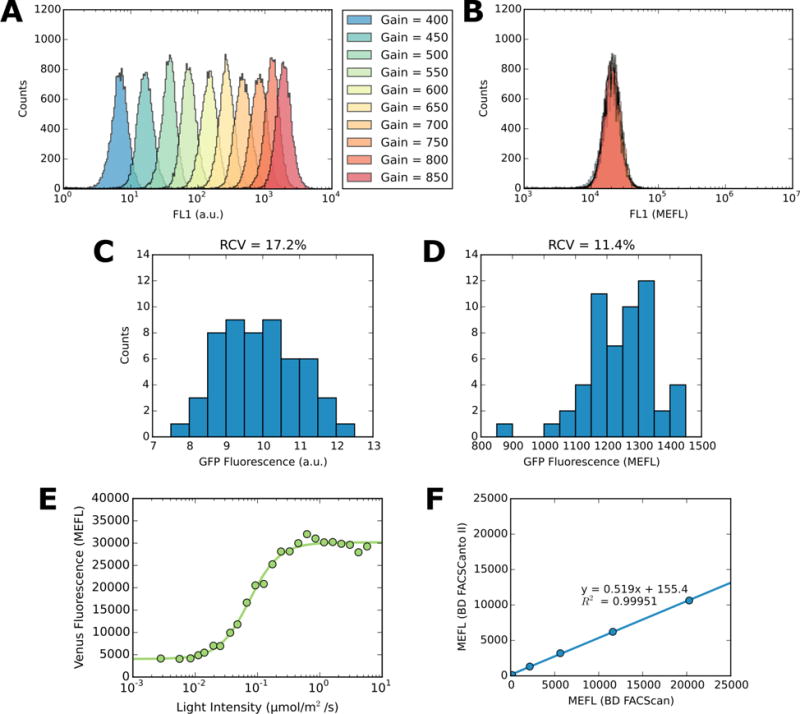
FlowCal histogram plots of a single sample of E. coli BW29655 expressing sfGFP from the IPTG-inducible promoter Ptac (16) when fully induced, measured at 10 different detector gain settings in (A) a.u., and (B) MEFL. Histograms of fluorescence values (geometric mean of each population) of E. coli expressing the CcaS-CcaR v2.0 system (17) in the dark, taken from 54 experimental replicates carried out over eight months in (C) uncalibrated arbitrary units (left) and (D) FlowCal calibrated molecules of equivalent fluorescein (MEFL) values. Robust coefficient of variation (RCV) is shown above each data set. (E) Dose response of the light-responsive PhyB-GBD/PIF3-GAD system in S. cerevisiae (19), where the yellow fluorescent protein Venus is transcribed in response to red (647nm) light. After incubating cells under the specified intensity of light for 18 hours, fluorescence was measured via flow cytometry, and the resulting data was analyzed using FlowCal. (F) E. coli BW29655 expressing sfGFP from the IPTG-inducible promoter Ptac were induced with 0, 81, 161, 318, or 1000 μM IPTG and measured using two different flow cytometers, along with calibration beads. The resulting data was calibrated to MEFL using FlowCal. Geometric mean fluorescence values in MEFL obtained from both instruments are plotted against one another, for each sample. A least-squares linear fit is also shown.
