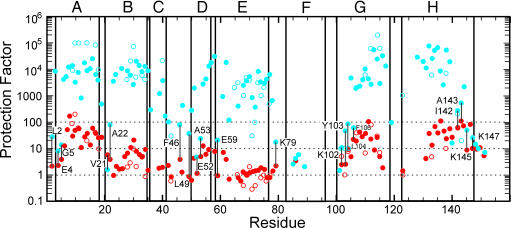
Fig. 2.
Plot of protection factor per residue obtained from the interrupted H/D exchange measurements made in DMSO solution (filled symbols) or in D2O solution [reproduced from the data of Hughson et al. (7)] (open symbols). Blue dots, pH 6.0; red dots, pH 4.0. Labels indicate residues for which the protection factor at the two pH values is comparable. The locations of helices in the folded structure of myoglobin are indicated with boxes. Dotted lines indicate protection factors of 1, 10, and 100. Letters A-H refer to helices.

