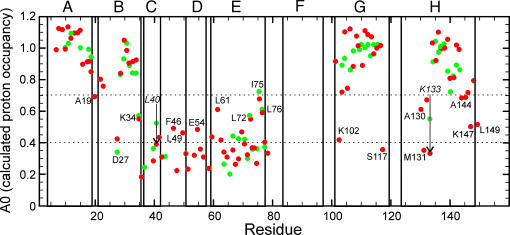
Fig. 4.
Plot of the calculated zero-time proton occupancy at a folding time of 6.4 ms for the burst phase intermediate in the pH-jump experiment in DMSO (red dots) and for the previously published urea-jump experiment in D2O (green dots) (13). Selected residues are labeled. The two italicized residues with arrows (L40 and K133) show significantly lower burst-phase proton occupancy in the DMSO experiment, changing from a classification of F+S to S. Dotted lines indicate the cut-off values for the classifications F, F+S, and S (see text). Letters A-H refer to helices.

