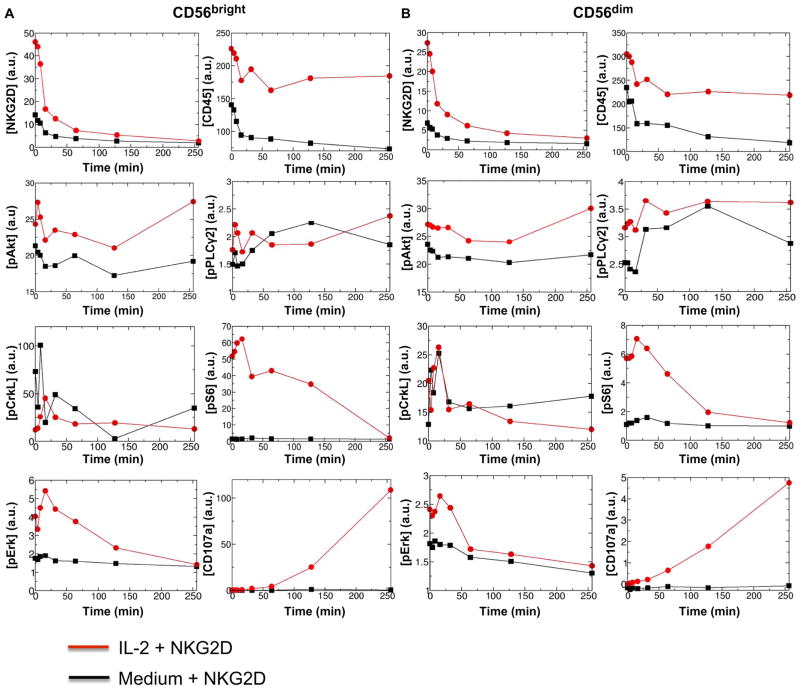
Fig. 1. Kinetics of average protein abundances in mass cytometry measurements in IL-2– or medium-treated CD56bright and CD56dim primary human NK cells stimulated by anti-NKG2D.
(A and B) Analysis of the kinetics of changes in the average abundances of the indicated proteins in CD56bright (A) and CD56dim (B) primary human NK cells at time 0 and at the indicated times after stimulation through NKG2D. a.u., arbitrary units. Before stimulation through NKG2D, the cells were pretreated with either medium (black lines) or IL-2 (red lines). Protein abundances were measured by mass cytometry in duplicate samples from each donor. The average protein abundances were calculated using Eq. 3A for the cell population in the duplicate samples. Data are from a single donor and are representative of two independent donors. The data from the second donor are shown in fig. S2. Cells from a third donor were analyzed to confirm the effect of pretreatment with IL-2 (fig. S7). For analysis of the kinetics of other proteins of interest, see fig. S1 and table S1.

