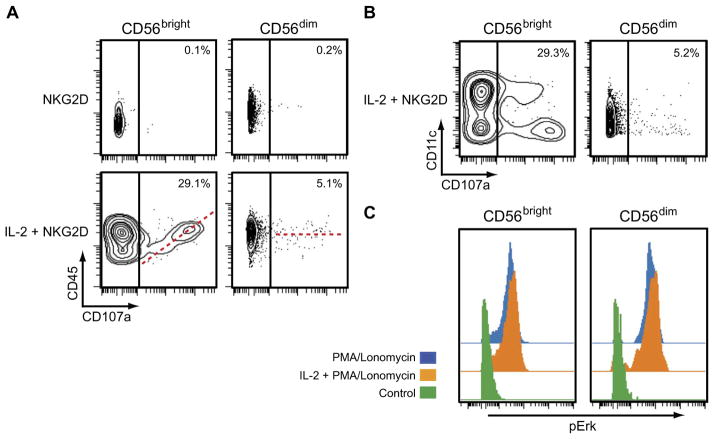
Fig. 6. Testing of model predictions.
(A) Mass cytometry analysis of CD45 and CD107a in CD56bright and CD56dim NK cells (obtained from donor #1) at 256 min after the cells were stimulated with anti-NKG2D antibody having first been treated with medium (NKG2D) or IL-2 (IL-2 + NKG2D). As predicted by the model, IL-2–treated CD56bright NK cells with greater amounts of CD45 exhibited increased relocalization of CD107a to the cell surface. IL-2–treated CD56dim NK cells with the greater amounts of CD45 showed a bimodal distribution of CD107a abundances on the cell surface. The dashed red line denotes the correlation between the abundances of CD45 and CD107a. Data are from a single donor and are representative of five independent donors. (B) Mass cytometry analysis of CD11c and CD107a abundances (NK cells obtained from donor #1) at 256 min after IL-2–pretreated CD56bright and CD56dim NK cells were stimulated with anti-NKG2D antibody. As predicted by the model, CD11c abundance played no role in determining the extent of NKG2D-stimulated CD107a relocalization in either NK cell subset. Data are from a single donor and are representative of five independent donors. (C) Mass cytometry analysis of the distribution of pErk in CD56bright and CD56dim NK cells at 16 min after incubation with medium, PMA alone, or PMA and ionomycin. The NK cells were first pretreated with either IL-2 (orange) or medium (blue). Unstimulated control samples are shown in green. Data are from a single donor and are representative of three independent donors.

