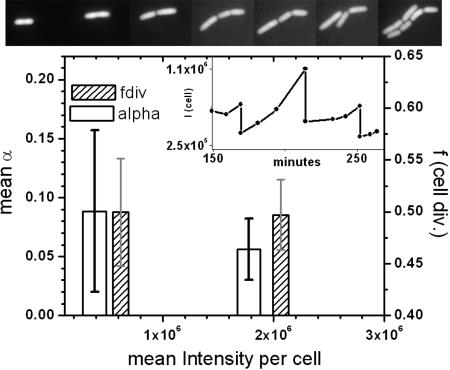
Fig. 4.
Dependence of noise in the rate of gene expression (α) and the noise in cell division (f) on mean gene expression level. fcell division = Idaughter/Imother. Inset shows a typical fluorescence time trace of a single cell through three cell divisions. (Upper) Snapshots of a bacterial colony at different time points, t = 46, 107, 137, 159, 169, 181, and 212 min (left to right).

