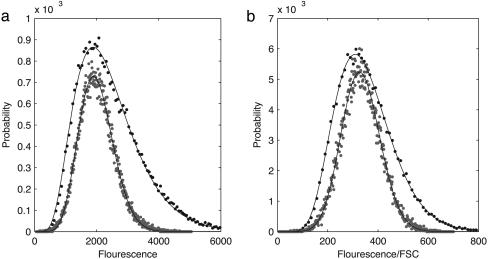
Fig. 5.
Distributions of fluorescence (a) and fluorescence normalized by the corresponding forward scatter signal (FSC) (b) for the 5th-hour (black circles) and 15th-hour (gray circles) samples. The 5th-hour distributions in both figures have been scaled down on the y axis and scaled up on the x axis for visual clarity. Black lines show the fit of the crossover function described in Phenomenological Analysis of Lognormal-to-Gaussian Crossover of Protein Distribution in Supporting Text to the distributions. Fits were obtained by using a nonlinear Levenberg-Marquardt least-squares fitting algorithm. Best fit parameters were as follows. In a, μ = -1.145 and σ = 0.551 for the 5th hour, and μ = 1.586 and σ = 0.649 for the 15th hour, with N0 = 1,500 kept fixed. In b, μ = -0.445 and σ = 0.477 for the 5th hour, and μ = 4.505 and σ = 0.994 for the 15th hour, with N0 = 100 kept fixed.

