Fig. 7.
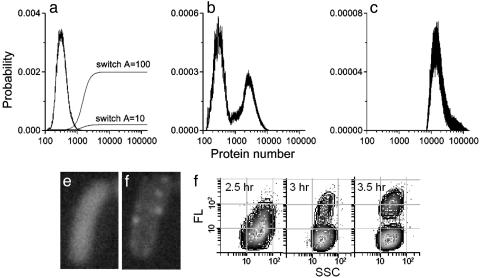
Response of protein distributions to regulatory switches. (a) Long-tailed protein distribution from a simulation run, superimposed with the response functions of a switch with a Hill coefficient of 4, a threshold of 1,500, and amplitudes of 10 and 100, respectively (for clarity of display the functions have been scaled by a factor of 2 × 10⁻⁵). (b) The modified protein distribution when the switch with A = 10 is added to the model (note the change in y scale). (c) The modified protein distribution when the switch with A = 100 is added to the model (note the change in y scale). (d and e) Fluorescence image of a cell under autoregulation at two different time points. d shows a uniform distribution of fluorescence, whereas e shows the same cell having bright spots at different places besides a uniform haze. (f) Scatter plot of fluorescence signal (FL) vs. side scatter (SSC) showing emergence of bimodality in the fluorescence distribution at 3.5 h, from a unimodal distribution at 2.5 h. The SSC distribution remains unimodal throughout.

