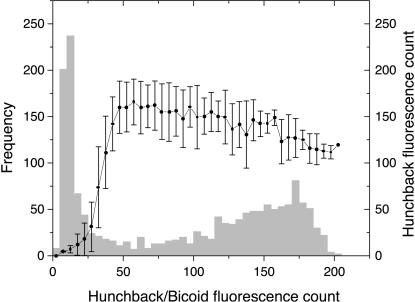
Fig. 8.
Light gray bars, histogram of hunchback fluorescence for anterior portion of embryo hx21 from the FlyEx database. Only the 1,606 nuclei with anterior-posterior coordinate between 10% and 70% of the egg length have been considered to create this histogram. Filled circles, an estimate of the response function of the bicoid switch. Each data point shows the mean hunchback fluorescence for nuclei in the corresponding bin (width of five counts) of bicoid fluorescence. Error bars are one standard deviation.

