
Fig. 2.
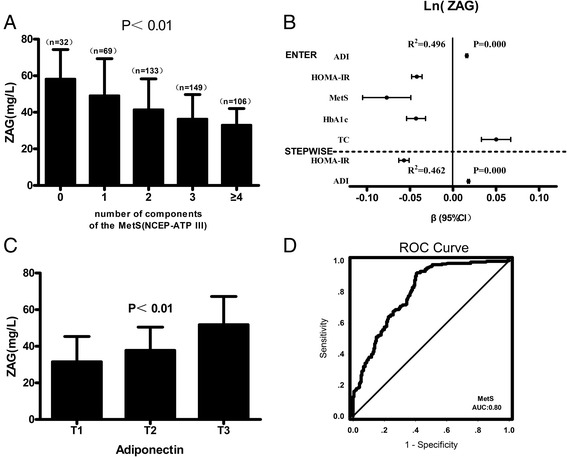
a: Circulating ZAG levels in relation to the number of MetS components; b: All factors and stepwise multiple regression analyses of the circulating ZAG and MetS in study population. The circles correspond to the regression coefficients (β) and the error bars indicate the 95% confidence interval of β. R 2 = coefficient of determination; c: Least square means of circulating level of ZAG according to ADI tertiles in all the subjects; d: ROC curve analysis was performed for the prediction of MetS. Values are means ± SD