Figure 6.
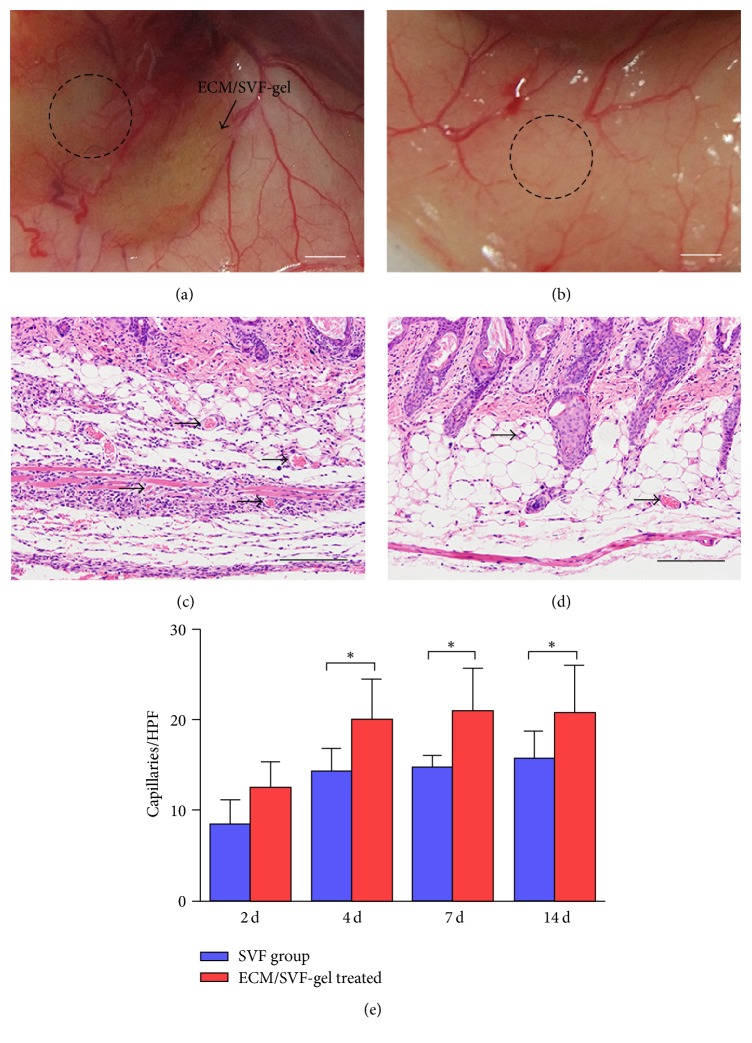
Vascularization and Immunofluorescence staining. Macroscopic visualization of subcutaneous blood vessels around the wound (dotted area) in ECM/SVF-gel treated group (a) and SVF cell treated group (b) at day 30. Scale bar = 2 mm. Observation of vessels (arrows) in skin HE stained sections in the ECM/SVF-gel treated group (c) and SVF cell treated group (d) at day 7. Scale bar = 200 μm. Quantification of capillary densities in HE stained skin sections (e) (∗P < 0.05).

