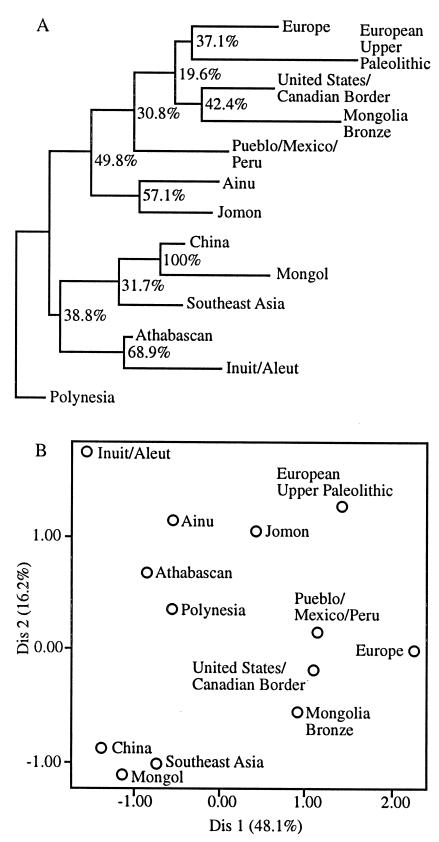
Figure 4.
A dendrogram based on the samples used to construct Fig. 3, plus a Bronze Age Mongolian group and four others from the Western Hemisphere. (A) The neighbor-joining method was used on 1,000 bootstrap samplings to generate the pattern displayed. (B) The relationships among the groups are also displayed by canonical discriminant function scores. The first discriminant function accounts for 48% of total variation, and the second accounts for 16%.

