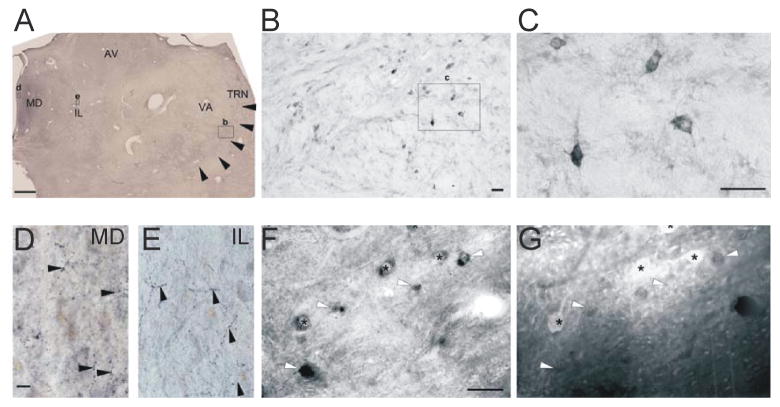
Figure 4. SOM cells in the Human nRT and SOM Projections to Higher-Order Thalamic Nuclei.
(A) Coronal section of the human thalamus at an anterior level (black arrowhead, nRT; small rectangles, position of the respective higher power images).
(B) SOM cells in the human nRT. Note the more scattered distribution of the neurons relative to the rodent condition due to the larger number of crossing fiber bundles.
(C) High-power images of SOM neurons displaying variable soma shape.
(D–E) Varicose SOM axons in the higher-order mediodorsal (D) and intralaminar (E) nuclei (black arrowheads).
(F–G) Some cells express only SOM (white arrowheads). SOM can co-localize with PV in certain nRT cells (asterisks). Scale bars: A, 1 mm; B, D–E, 50 μm; C, 25 μm; F–G, 20 μm. AV, anteroventral; IL, intralaminar; MD, midline; nRT, nuclear reticular thalamus; VA, ventral anterior thalamic nuclei.

