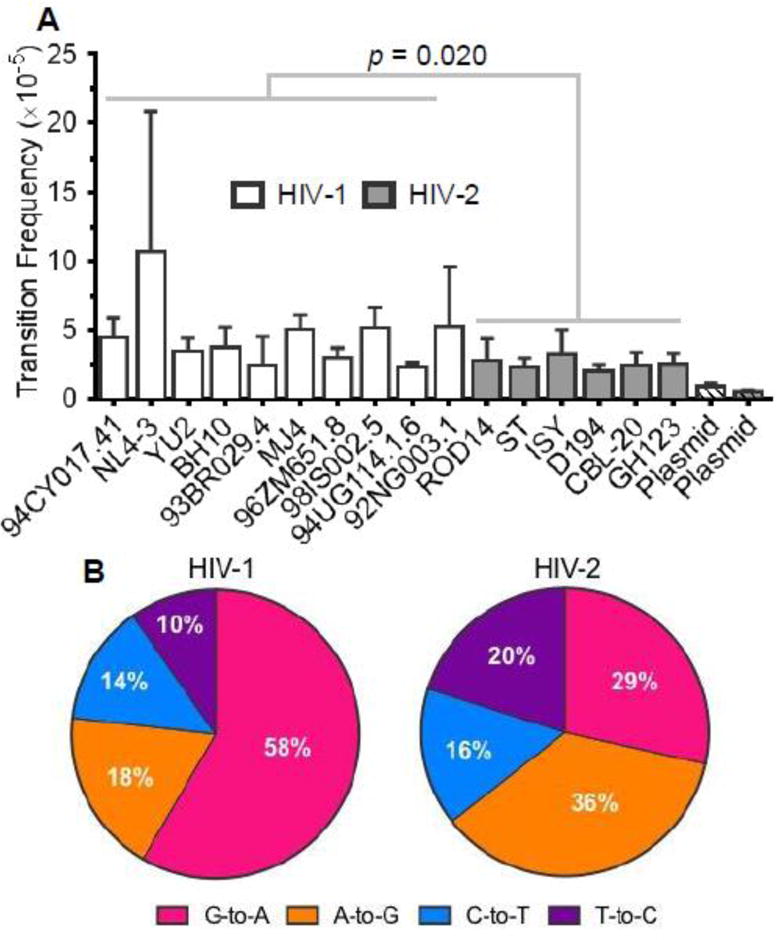
Figure 2. Comparison of transition frequencies and spectra between HIV-1 and HIV-2.

A. Transition frequency analysis. Transition frequencies were calculated by dividing the number of transition mutations by the number of reference bases (mutations + wild-type bases) and are expressed as mutations/bp. Transition frequencies were determined for 10 HIV-1 vectors and 6 HIV-2 vectors, as well as for plasmid controls, which indicate the level of residual background error. The data represent the average of three independent biological replicates, with error bars indicating standard deviation. HIV-1 and HIV-2 transition frequencies were compared statistically using generalized linear mixed effects models (see Methods). In these tests, data were not pooled across viral isolates or biological replicates. B. Transition spectra analysis. Transition spectra were determined by dividing the frequency of each type of transition by the total transition frequency, with the results expressed as a percentage of total transitions. The data represent the average transition spectra across all HIV-1 or HIV-2 vectors.
