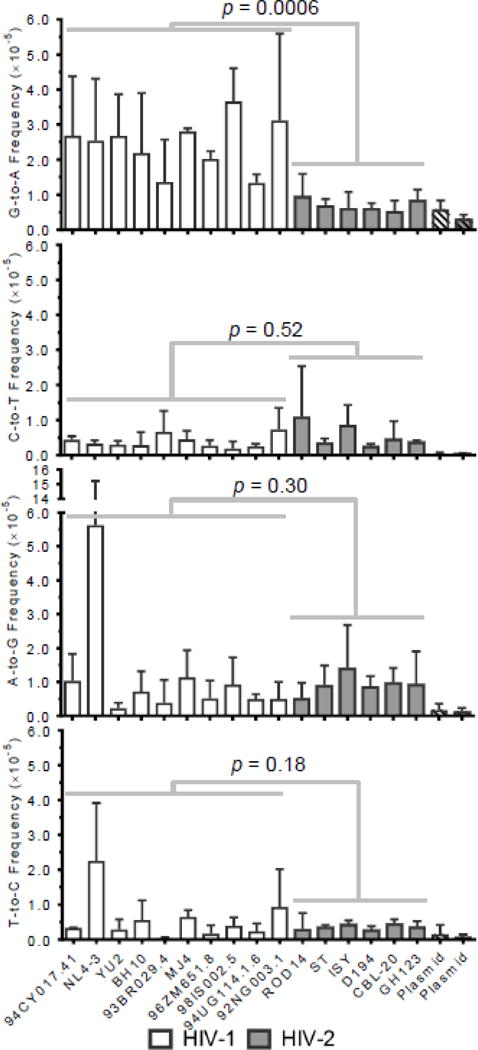
Figure 3. HIV-1 exhibits higher levels of G-to-A transition mutations than HIV-2.

To compare the mutagenesis of HIV-1 and HIV-2 in greater detail, mutation frequencies were calculated for each type of transition for all HIV-1 and HIV-2 viral vectors. Mutation frequencies were calculated by dividing the number of mutations (of the indicated type) by the number of reference bases (mutations + wild-type bases) and are expressed as mutations/bp. The data represent the average of three independent biological replicates, with error bars indicating standard deviation. Individual transition frequencies were compared between HIV-1 and HIV-2 using generalized linear mixed effects models (see Methods). Data were not pooled across viral isolates or biological replicates in these analyses.
