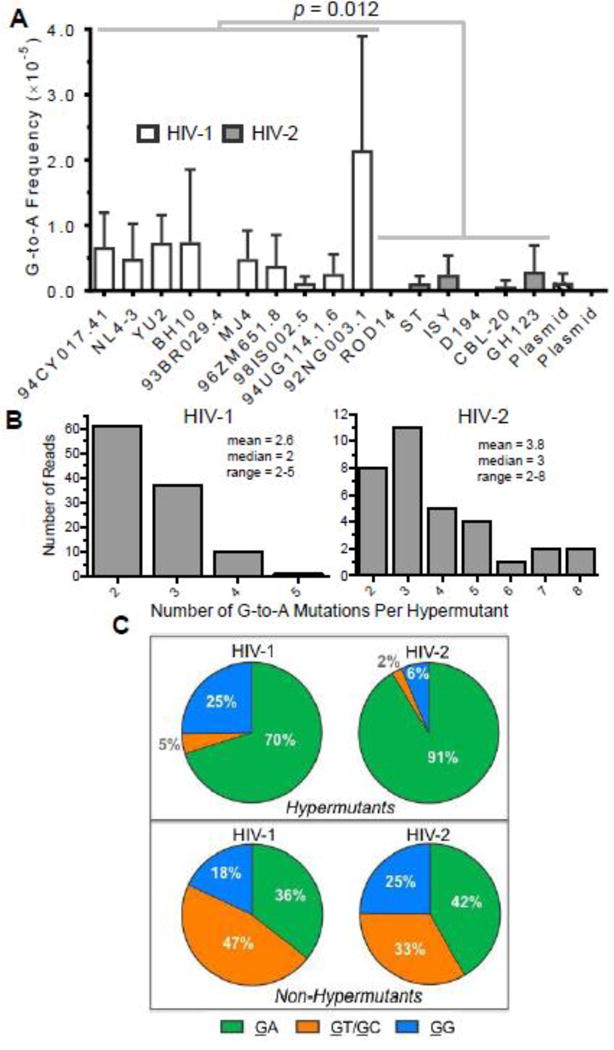
Figure 4. HIV-1 and HIV-2 generate G-to-A hypermutants consistent with APOBEC3 editing.

A. G-to-A hypermutation analysis. The frequencies of G-to-A mutations from hypermutants were determined for all HIV-1 and HIV-2 vectors as well as for plasmid controls. For this analysis, hypermutants were defined as consensus reads (200 bp in length after bioinformatics processing) containing two or more G-to-A mutations. G-to-A mutation frequencies from hypermutants were then calculated by dividing the number of G-to-A mutations (in hypermutants only) by all reference bases. HIV-1 and HIV-2 G-to-A mutation frequencies were compared statistically using generalized linear mixed effects models without pooling data across viral isolates or biological replicates (see Methods). Further, the data were analyzed with or without the outlier HIV-1 92NG003.1. B. The degree of G-to-A hypermutation was assessed by determining the numbers of G-to-A mutations within hypermutant reads. C. The 3’ dinucleotide contexts of G-to-A mutations from G-to-A hypermutants or non-hypermutants (i.e., single mutants) was determined and expressed as a percentage of the total. Sites of mutation are underlined (e.g., GG). In panel A, the data represent the average of three independent biological replicates, with error bars indicating standard deviation, while the data in panels B and C represent total (i.e., compiled) data.
