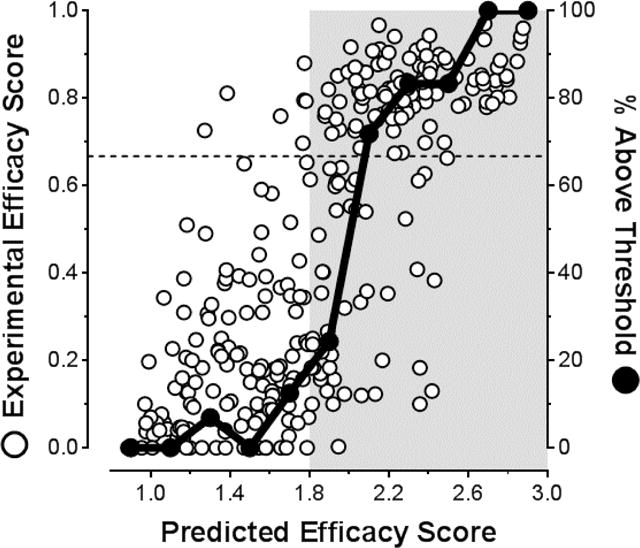
Figure 3.

Examination of the correlation between Predicted Efficacy Scores (PES) of kinetic stabilizers and their Experimental Efficacy Scores (EES). EES and PES values for individual compounds were calculated using Equations 1 and 2, respectively. The dashed line at EES = 0.667 represents a scenario where an inhibitor binds with a stoichiometry of 1 molecule per TTR tetramer, which has been shown sufficient to completely inhibit TTR aggregation (i.e., 0% fibril formation).29 Solid black data points represent the percentage of compounds within the 0.2 PES bins that exceed the EES = 0.667 cutoff. The area shaded grey represents the PES region where significant enrichment of molecules above this cutoff occurs: that is, where the greatest proportion of highly desirable, potent and selective TTR aggregation inhibitors are predicted (PES > 1.8). Please refer to Table S1 in the Supporting Information for a complete tabulation of all values.
