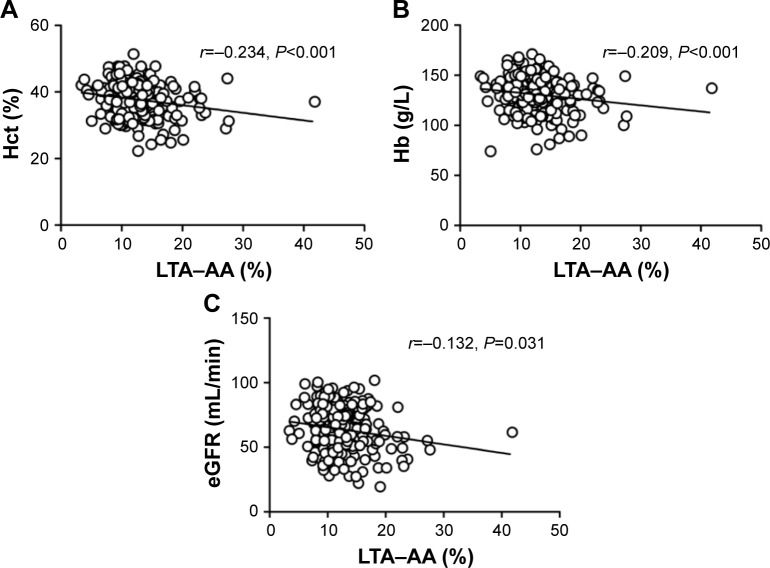
Figure 2.
Spearman’s correlation analysis.
Notes: (A) Hematocrit (r=−0.234, P<0.001) was negatively associated with LTA–AA. (B) Hemoglobin (r=−0.209, P<0.001) was inversely correlated with LTA–AA. (C) eGFR (r=−0.132, P=0.031) was inversely correlated with LTA–AA.
Abbreviations: eGFR, estimated glomerular filtration rate; Hb, hemoglobin; Hct, hematocrit; LTA–AA, light transmission assay-arachidonic acid.

