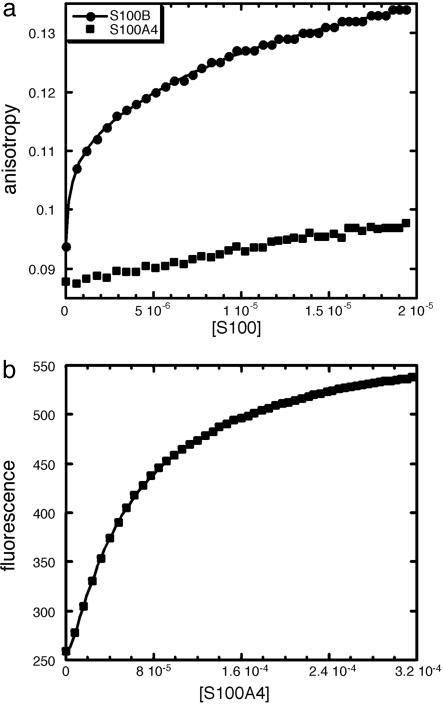
Fig. 2.
Binding of S100B and S100A4 to p53CT (residues 293-393 of p53). (a) Comparison of the binding of S100B and S100A4 to 0.1 μM fluorescein-labeled p53CT by using fluorescence anisotropy. S100B binding curve fits to a two-site model (continuous line). Concentration of dimeric protein is in molar units (M). (b) Binding of S100A4 to fluorescein-labeled p53CT analyzed by fluorescence. The continuous line shows the fit to a two-site model. Concentration of dimeric S100A4 is in molar units (M).

