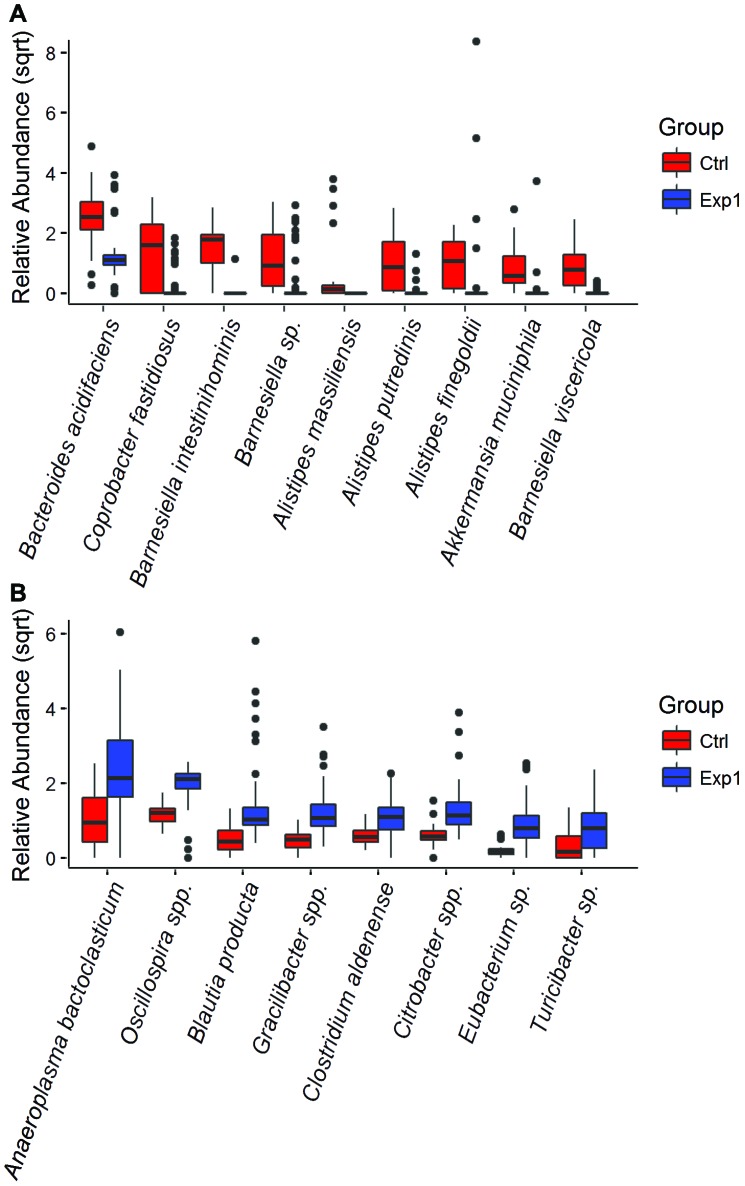
Figure 4.
Boxplots of relative abundance of representative genera in control mice (Ctrl) and antibiotic-treated microbiota-reconstituted mice (Exp1). Only the taxa with an abundance greater than 1% are plotted, with P < 0.05. (A) Taxa with higher abundance in control mice. (B) Taxa with higher abundance in the Exp1 group. Statistical tests were performed within QIIME by using nonparametric ANOVA with Bonferroni correction for 999 permutations.

