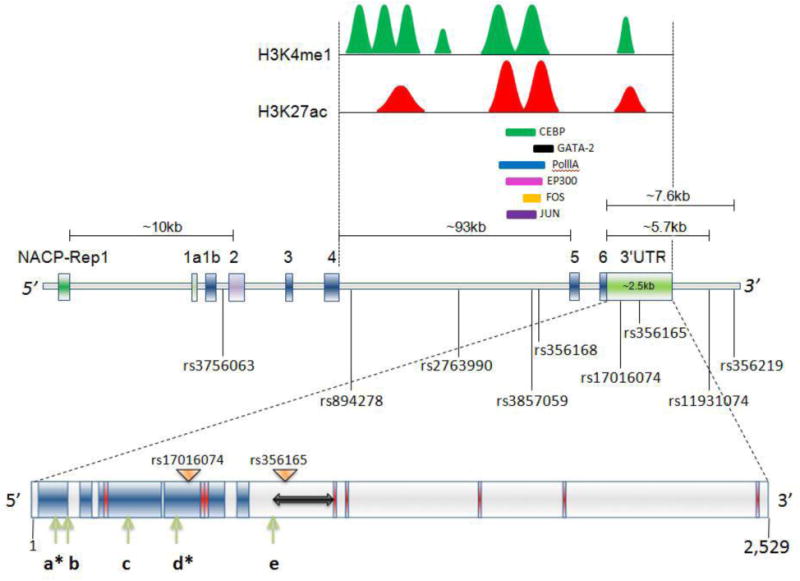
Figure 3. SNCA gene regulation depends on its non-coding region.

SNCA gene is around 114 kb long which encompasses 6 exons and one very long intron4/5 of around 93 kb. A polymorphic repeat-based enhancer element is present at around 10 kb upstream of ATG known as NACP-Rep1. The intron 4/5 area harbors two distinct regions where transcriptionally active marks H3K27ac (red peaks) and H3K4me1 (green peaks) signals are present. Several transcription factors along with polymerase IIA (Pol IIA) bind to those areas cell type specifically, some of which are shown in the figure. The entire gene harbors thousands of SNPs; of which some significantly demonstrate a repeated association with PD are shown in the figure with their respective IDs and relative position. Two SNPs which were significantly associated with the disease (rs11931074, rs356219) are located around 5.7 and 7.6 kb downstream of the stop codon respectively. The 3′-UTR region of SNCA is approximately 2,529 nucleotides and harbors several motifs and microRNA (miR) binding sites. Features of the long 3′-UTR of SNCA and its regulatory elements are shown: regions in red depict alternative poly (A) signals; arrows labeled a through e are indicative of micro-RNA binding sites (miR-7, miR-34b, miR-34b, miR-153 and miR-34C respectively). Asterisks illustrate miR-7 and miR-153 binding sites that result in significant repression of SNCA. The double-sided arrow represents the LINE region of the SNCA-3′-UTR and dark-blue areas represent the conserved regions of 3′-UTR across the species. Locations of the two SNPs in the UTR that are implicated in PD are shown by the triangles labeled with their respective IDs. The 3′-UTR motifs and conserved sequences are depicted according to Sotiriou et al. (2009). The binding sites of all the microRNAs shown here are adopted from references as discussed in the text (Doxakis, 2010; Kim et al., 2013; Choi et al., 2014; Kabaria et al., 2015). The locations of the H3K27ac/H3K4me1 peaks are adopted from ENCODE. The peak heights, distribution and area under the peaks are not in exact scale.
