
Figure 4. Enhanced mutagenesis of genes, promoters, and multiple loci with hyperactive AID*Δ.
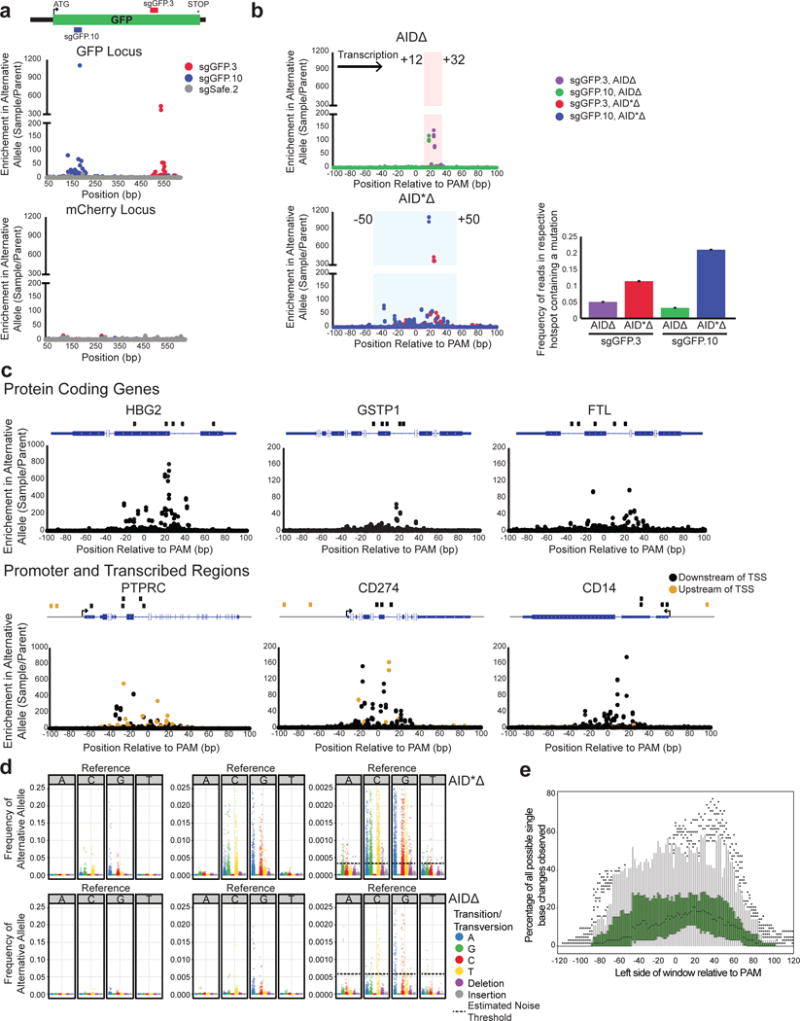
a) sgGFP.3, sgGFP.10, and sgSafe.2 were infected into cells expressing dCas9, MS2-AID*Δ, GFP, and mCherry. The GFP and mCherry loci were sequenced. Enrichment of mutations at each base position in both loci is shown. b) Enrichment of mutations at positions relative to the sgRNA PAM is shown for 2 GFP-targeting sgRNAs, sgGFP.3 and sgGFP.10, using either AIDΔ (top graph) or hyperactive AID*Δ (bottom graph). The shaded rectangles highlight the respective hotspot regions. (right) The frequencies of mutated sequences in the respective hotspots are shown. Error bars indicate standard error. c) sgRNAs were designed to target six endogenous loci. Gene diagrams for each locus are shown indicating the position of the respective guides. Cells expressing dCas9 and MS2-AID*Δ were infected with the sgRNAs, and the loci were sequenced. Shown are graphs of the enrichment of mutations at positions relative to the PAM at each of the loci. Samples with sgRNAs targeting upstream of the transcription start site are shown in orange. d) Transition and transversion mutations observed using AID*Δ and AIDΔ are shown at three different scales. At each base in the hotspot region, the frequency of each transition was calculated and normalized to the parent population. The AID*Δ transitions were tabulated from mutations generated with sgGFP.3, sgGFP.10, and sgRNAs targeting endogenous loci. The mutations induced by AIDΔ were tabulated from sgGFP.1–12. The standard deviation of alternative allele frequencies in the parental samples were calculated and indicated by the dashed black line. e) Graph of the percentage of all possible single base changes observed for AID*Δ targeted with sgRNAs (described in Fig. 4a,c) in a 21bp sliding window. Single base changes with a frequency above the estimated noise were counted over a 21bp window beginning at the indicated position relative to the PAM, and the measured fraction of all possible changes is reported for each window. Box plots at each position are shown summarizing the distribution observed over all sgRNAs. The box plot lines represent 1.5X the interquartile range.