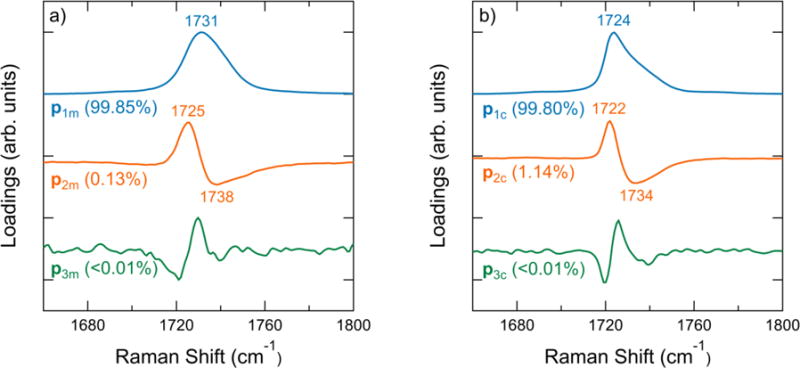
Figure 3.

a) Principal components of PCL spectra in the melt from 62 °C to 160 °C. b) Principal components of spectra during crystal melting from 20 °C to 62 °C. The position in cm−1 is labeled near peak extrema. The percentage of the total variance explained by each principal component is indicated in parentheses. See Supplementary Material for the variance of additional principal components.
