
Figure 5.
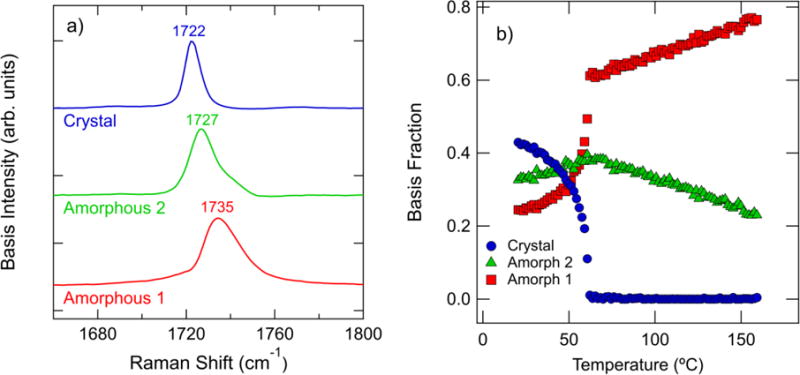
a) Estimated basis spectra of the Raman spectra in the carbonyl stretch region. b) Integrated intensity of the components in (a) plotted versus temperature. The intensities are normalized by the total integrated area in the carbonyl stretch region. The results of every 3rd spectra are plotted for clarity in (b).