Figure 6.

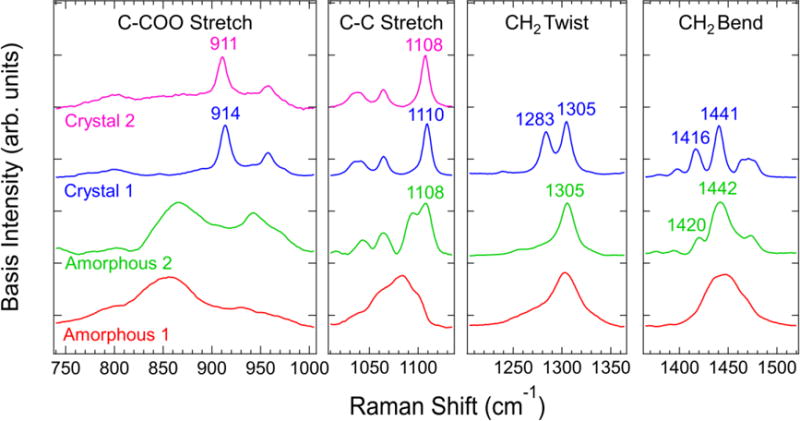
From left to right: estimated basis spectra in the indicated C-COO stretch, C-C stretch, CH2 twist, and CH2 bend region.

From left to right: estimated basis spectra in the indicated C-COO stretch, C-C stretch, CH2 twist, and CH2 bend region.