Figure 9.

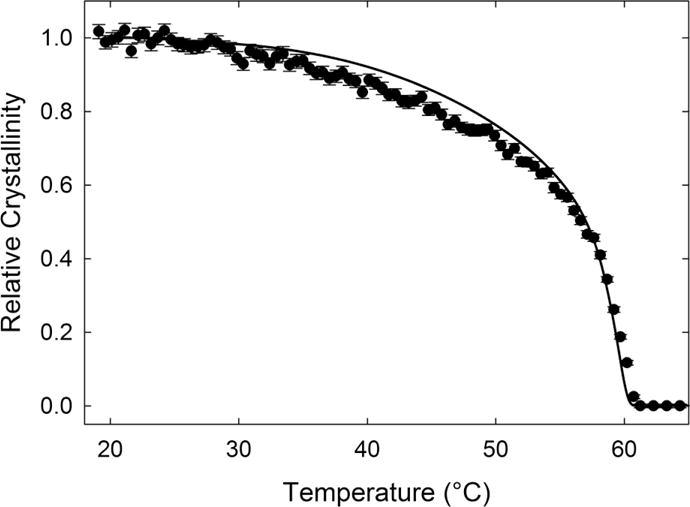
Comparison of relative crystallinity versus temperature for PCL. The solid points indicate Raman measurements and the line indicates the DSC measurement. The temperature ramp is 1 °C/min.

Comparison of relative crystallinity versus temperature for PCL. The solid points indicate Raman measurements and the line indicates the DSC measurement. The temperature ramp is 1 °C/min.