Fig. 2.
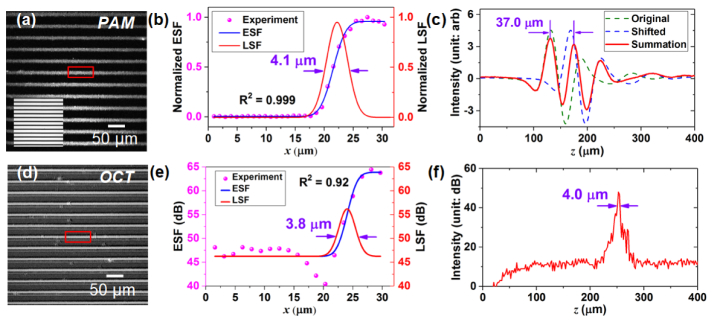
System performance calibration using a chromium grating (linewidth: 10 μm, pitch: 40 μm) coated on a coverslip. (a) PAM image of the grating. Inset is the bright field image. (b) Fitted edge spread function (ESF) and line spread function (LSF) of the experimental data in the rectangular box in (a) show that PAM has a lateral resolution of 4.1 μm. (c) Summation of two A-line axial spread function shows that PAM has an axial resolution of 37.0 μm. (d) OCT image of the grating. (e) Fitted ESF and LSF of the experimental data in the rectangular box in (d) show that OCT has a lateral resolution of 3.8 μm at −6 dB. (f) A-line spread function shows that OCT has an axial resolution of 4.0 μm at −6 dB in air.

