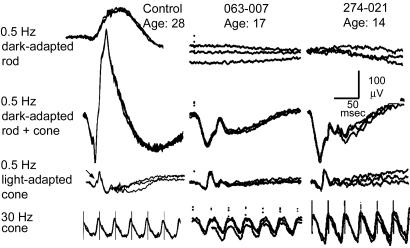
Fig. 2.
ERGs of a normal control and patients 063-007 at age 17 and 274-021 at age 14 recorded at the Berman-Gund Laboratory at MEEI. The top row shows the dark-adapted rod responses to 0.5-Hz blue light flashes; the second row shows the dark-adapted rod-plus-cone responses to 0.5-Hz bright white light flashes; the third row shows the light-adapted cone responses to 0.5-Hz flashes; and the bottom row shows the cone responses to 30-Hz white light without a background light. In each tracing, two or three sweeps are super-imposed to illustrate reproducibility. In the 0.5-Hz cone response in the normal control (third tracing from the top), an oblique arrow points to an oscillation on the upward slope of the b-wave that is not observed in the patients. (Scale bars: 50 msec horizontally and 100 μV vertically for all tracings.)

