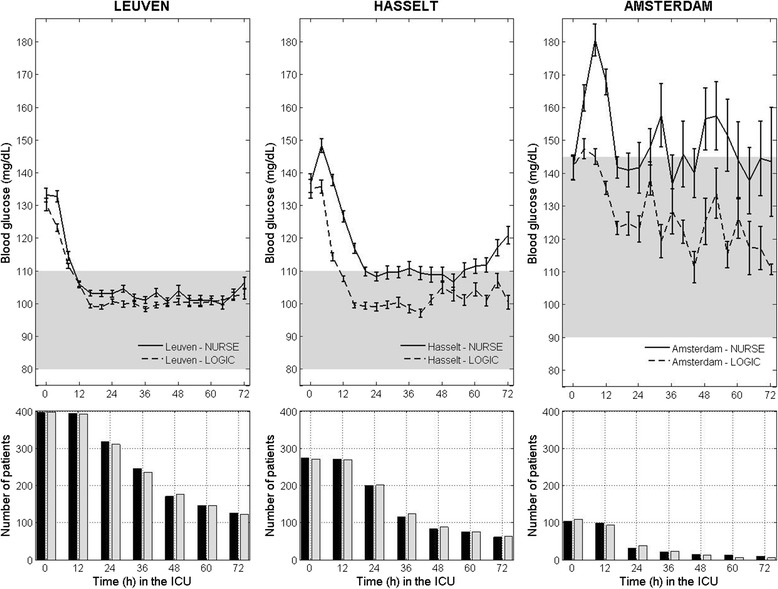
Fig. 2.

Blood glucose control and numbers of patients in the two randomized groups during the first 3 days in the ICU, per study center. Upper panels overall mean blood glucose levels (mg/dL) for both the algorithm-guided (dashed line) and the nurse-directed (solid line) blood glucose control group per center during the first 72 h in the ICU, which is the median ICU stay. The average blood glucose is computed over all glucose samples (per center) belonging to the previous 4-h time slot. The glycemic target range was 80–110 mg/dL for Leuven and Hasselt, unlike Amsterdam where the glycemic target range was 90–145 mg/dL. Lower panels the number of patients for the Nurse-C group (Nurse) (black bars) and LOGIC-C group (LOGIC) (gray bars)
